众所周知,GNU Make 是地球上最好的构建工具,它的可读性非常好,完全不需要调试。
但是笔者眼拙,对着稍显复杂的项目没看明白,还得依靠第三方工具 remake 才能勉强梳理。
错误的调试方式
标题强调“正确地调试”,是因为我觉得 GNU Make 本身提供了错误的调试方式:
- 使用
$(info)、$(warn)和$(error)等注入手段。 - 使用
make [OPTION],它确实提供了-n(dry run 模式)和-d(debug 模式)选项。
第一种做法的介绍可看这里,这种方式无异于在一个 C 程序里每次插入 printf()。侵入式的缺陷就不多说了,只能说可以快速处理有限的问题。
第二种做法看似调试,其实是 dump 出内部的环境以及寻找依赖的过程。思路上似乎没啥问题,可以品鉴下图 dry run 模式输出的信息。
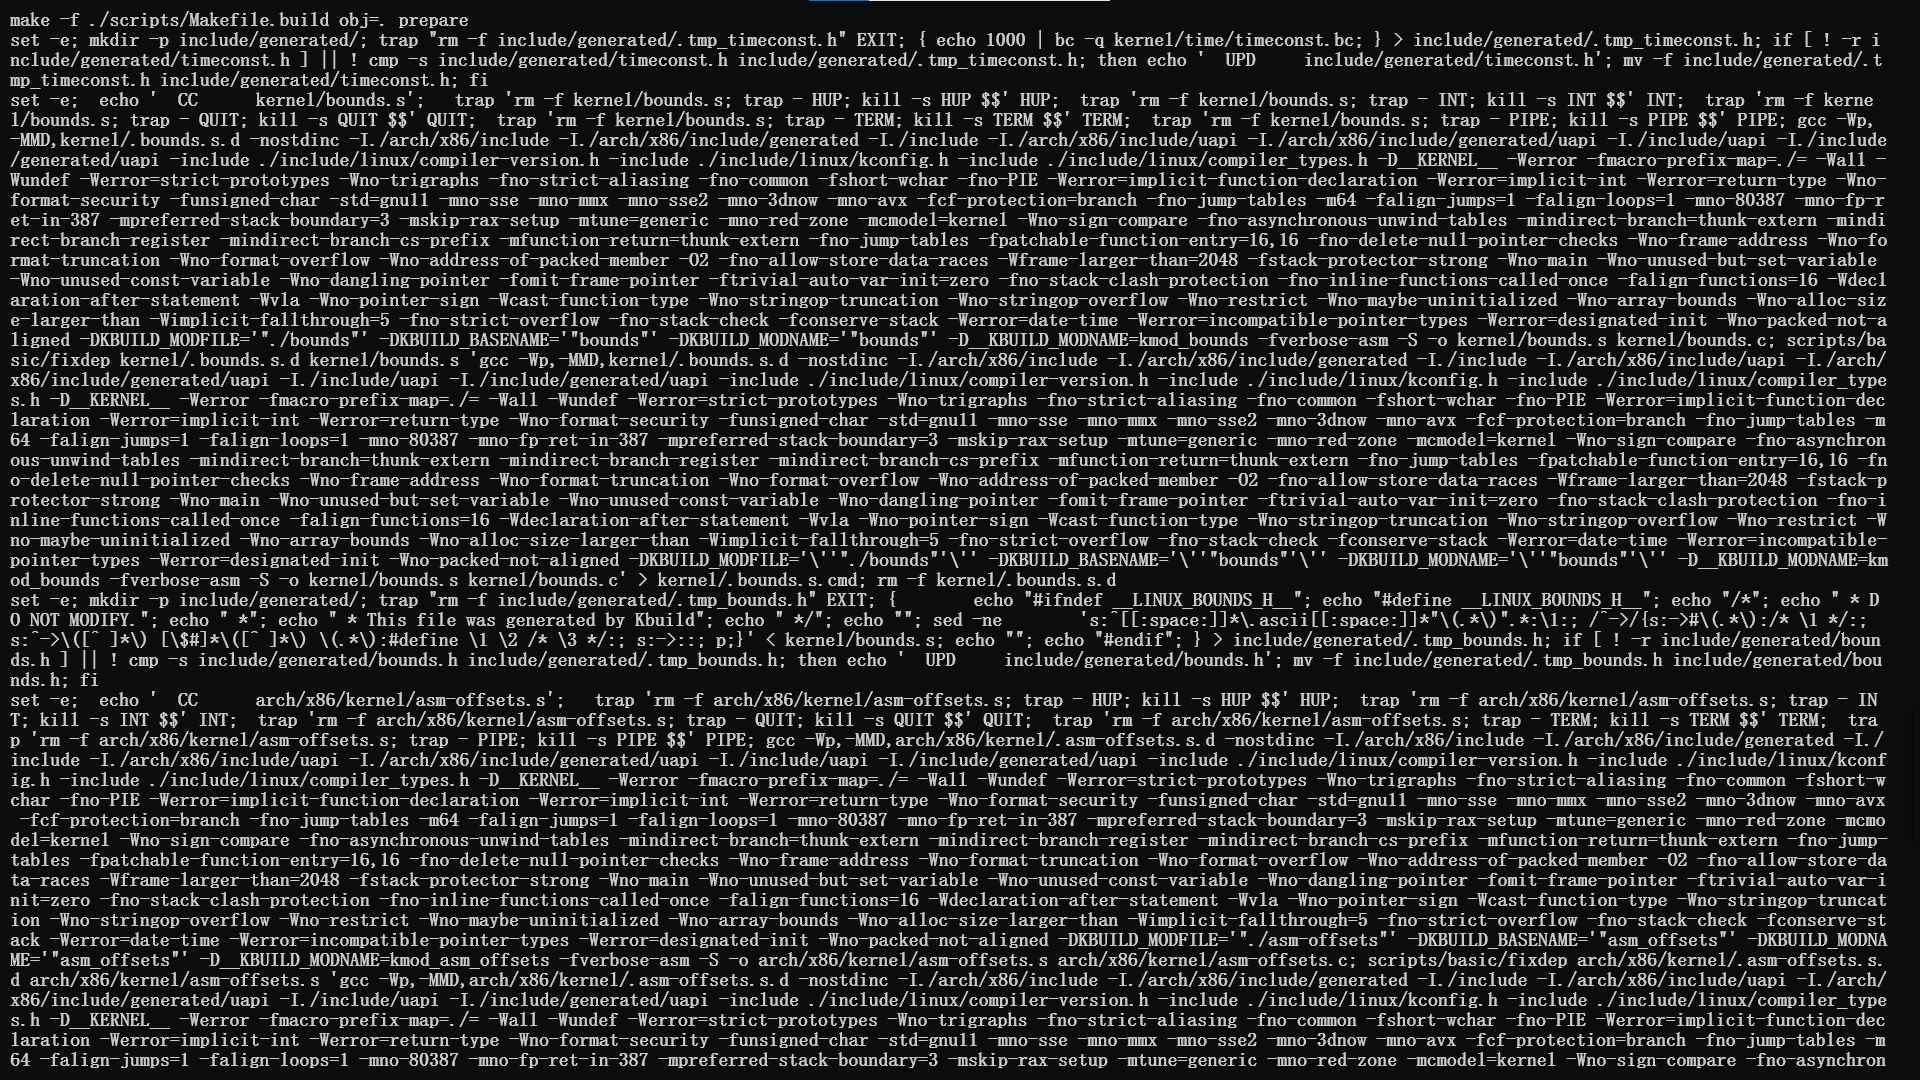 也许该买一个 100 寸的屏幕
我是根本看不懂啊!
如果你有耐心,这种办法应该能足够解决所有问题,因为它提供的信息足够详尽。但我希望有一种更好的办法,能做到指哪打哪。
正确的调试方式
正确的调试方式就应该用调试器,它可以给人运行时的、非侵入式的调试方式。
而 remake 正是如此。
简单点说它就是构建期的 gdb,语法也类似,相信各位看一眼就能找到熟悉的感觉。
NOTE: remake 不只是调试器,虽然功能不算特别多,但还涵盖了日志跟踪以及性能分析,以及它本身是一个 GNU Make 的 fork 版本,这意味着 make 已有的选项都大概能用。
Getting started
我这里简单介绍调试功能,并且用 Linux 内核的 Makefile 作为示例。
要启动调试器只需 remake -X [target],关闭就是 quit。
断点
使用 break 进行断点:
break <line>:指定当前 Makefile 行数断点。break <target>:指定目标断点。delete <id>:删除指定断点。
使用 step、continue、next、finish 可完成日常的调试任务。
一个好使的办法是 continue <target>,可以直接运行并停在对应的目标上。
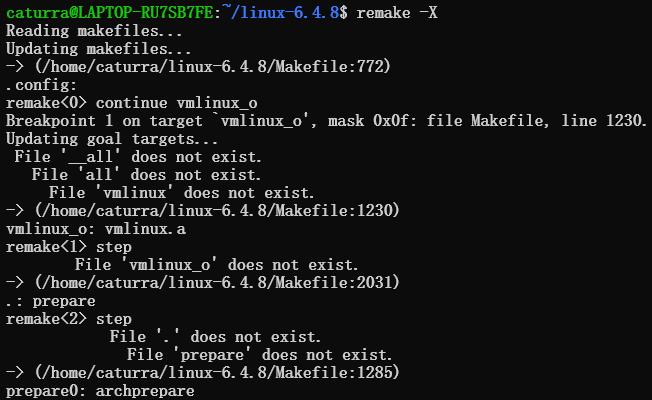 一个例子
一个例子
比如这里用到数千行的 Makefile,省略了单步过程,直接跳到目标 vmlinux_o,此时对应于 Makefile:1230。然后 step 两遍,由于有 prepare: prepare0 的依赖关系,最终定位到 prepare0。
NOTE1: 常用的命令缩写也适用于 remake,比如 b、s、n 等等。
NOTE2: 也可以使用 $(debugger) 在 Makefile 文件内生成断点。
NOTE3: 图里多次提示文件不存在是正常的,因为现在就是构建期。
定位
使用 backtrace 查看当前回溯信息。
使用 list,查看当前定位的行数。
使用 frame,切换栈帧。
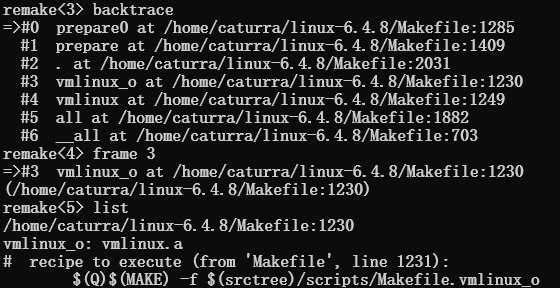 刚才的例子·续
这些都挺直观的,没啥好解释。
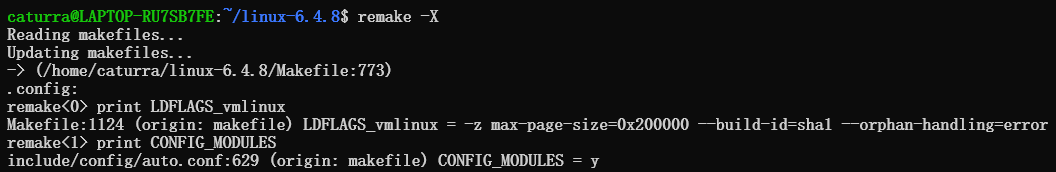
观测
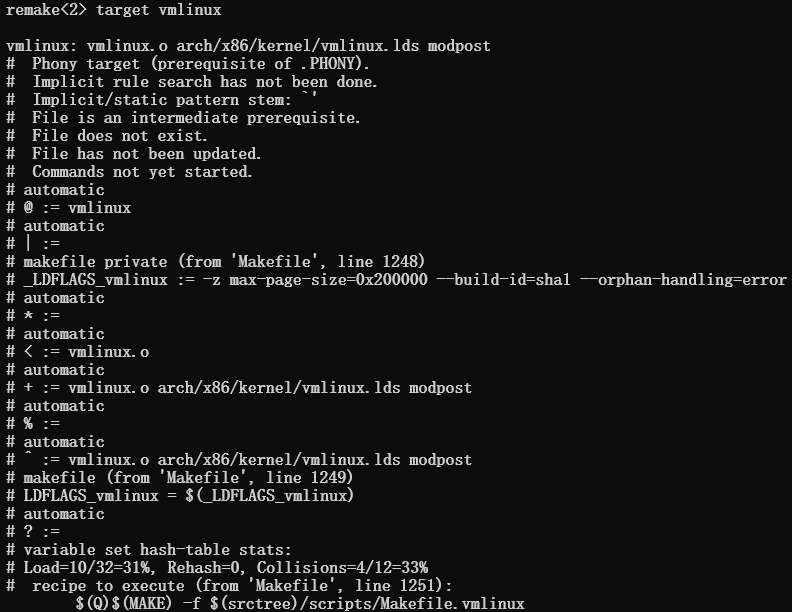
使用 print <variable> 输出变量。这个命令非常有用,比如 Makefile:536 行存在空变量 $(LDFLAGS_vmlinux),这个变量后续会按条件进行拼接,分析很麻烦。这个时候调试只需要 print LDFLAGS_vmlinux 即可;同时对于宏也可以直接输出,比如 print CONFIG_MODULES 可以得知这个配置是否打开:
使用 target <target> 查看指定目标的信息。注意前面的 print 并不能输出目标,因此用 target 命令。这个命令方便在于可辅助分析自动变量(比如 ^?+@ 这些符号)和隐式规则。
还有 info。子命令很多,见下表。
| 命令 | 说明 |
|---|---|
| info break | List all Breakpoints |
| info files | Show Read-in Files |
| info frame | Show Target Stack Frame |
| info line | Show the Current Line |
| info program | Show Makefile Information |
| info rules | Show Implicit or Pattern Rules |
| info target | Show Target Name |
| info targets | Show Targets found in Makefiles |
| info tasks | Show Targets with Descriptions |
| info variables | List all Variables |
更多
更多可参考文档:Debugger Commands。
调试以外
正如前面所说,remake 的功能不止于调试。这里简单列下 trace 和 profile 用法。
更友好的 trace
假设存在一个极其简单的 Makefile 文件:
all: hello world

hello:
	@echo "Hello"

world:
	@echo "World"
使用 remake --trace 可输出清晰的依赖关系和执行顺序:
Reading makefiles...
Updating makefiles...
Updating goal targets...
 File 'all' does not exist.
   File 'hello' does not exist.
  Must remake target 'hello'.
Makefile:4: target 'hello' does not exist
##>>>>>>>>>>>>>>>>>>>>>>>>>>>>>>>>>>>>>>>>>>>>>>>>>>>>>>>>
echo "Hello"
##<<<<<<<<<<<<<<<<<<<<<<<<<<<<<<<<<<<<<<<<<<<<<<<<<<<<<<<<
Hello
  Successfully remade target file 'hello'.
   File 'world' does not exist.
  Must remake target 'world'.
Makefile:7: target 'world' does not exist
##>>>>>>>>>>>>>>>>>>>>>>>>>>>>>>>>>>>>>>>>>>>>>>>>>>>>>>>>
echo "World"
##<<<<<<<<<<<<<<<<<<<<<<<<<<<<<<<<<<<<<<<<<<<<<<<<<<<<<<<<
World
  Successfully remade target file 'world'.
Must remake target 'all'.
Successfully remade target file 'all'.
即使是大型项目,只要用游标卡尺确认缩进也能得出依赖的嵌套关系。
个人体验和 make -d 差不多,只是后者更加复杂,有 800+ 行的日志。
简单的 profile
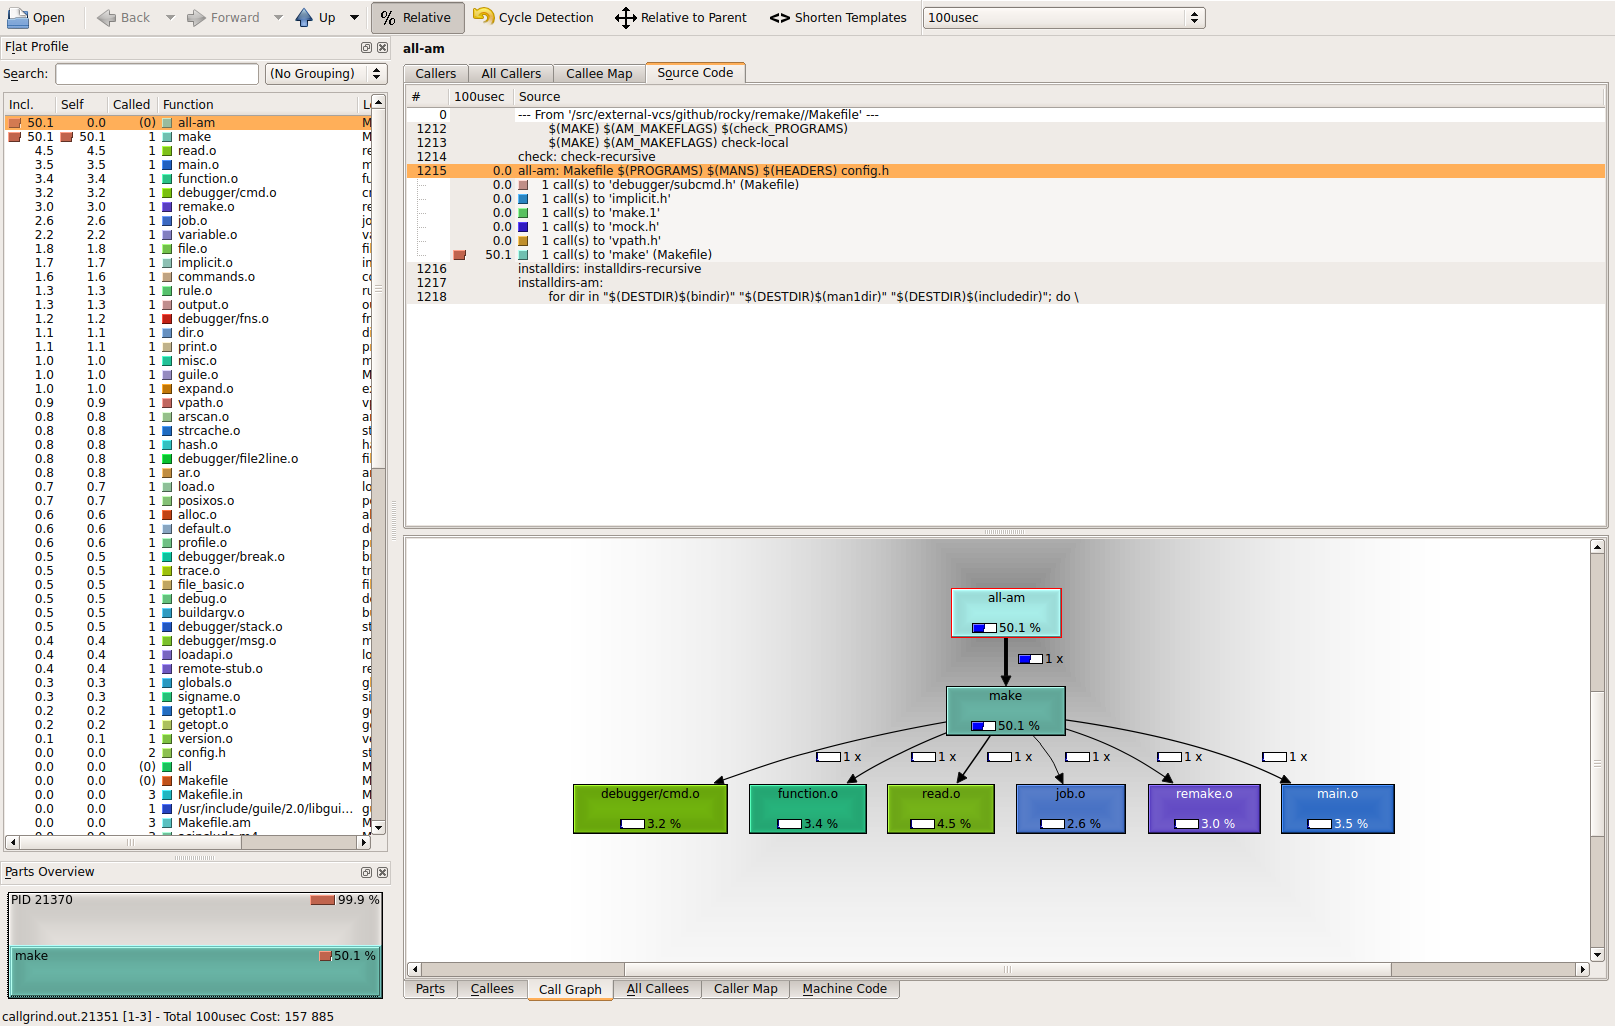
使用 remake --profile 即可进行性能分析,生成 callgrind 调用图。
没用过,看着挺方便的,就从 github 搬了张演示图。
就这样吧
本文就简单分享一下也许好用的工具。remake 稳定性可能不算理想,我在实测过程中发现 .mod 依赖识别出错,还需要自己动手修复才能完整调试。但不管怎么说,整体体验是更易于梳理 Makefile。
最后愿天堂没有 GNU Make。
本文已转发到知乎。